PHPEclipse is a PHP development plugin for the Eclipse IDE Framework. And, XDebug is a PHP extension which provides debugging and profiling capabilities.
I am using Ubuntu Operating System. This article provides a step-by-step guide on installing and setting up XDebug in PHP Eclipse in Ubuntu.
Install XDebug in Ubuntu
Open terminal and type the following command:-
sudo apt-get install php5-xdebug
This will install XDebug.
Update xdebug.ini file
Type the following command on terminal to open xdebug.ini for edit:-
sudo gedit /etc/php5/apache2/conf.d/xdebug.ini
Add the following lines in it:-
xdebug.remote_enable=1
xdebug.remote_handler=dbgp
xdebug.remote_mode=req
xdebug.remote_host=127.0.0.1
xdebug.remote_port=9000
Restart Apache
Type any one of the following command on terminal to restart apache:-
sudo /etc/init.d/apache2 restart
or,
sudo service apache2 restart
We have now installed XDebug and made necessary settings in its ini file as well. Now, we will see how to make necessary settings for XDebug in PHP Eclipse.
Eclipse Settings
– Open Eclipse IDE
– Go to Window -> Preferences
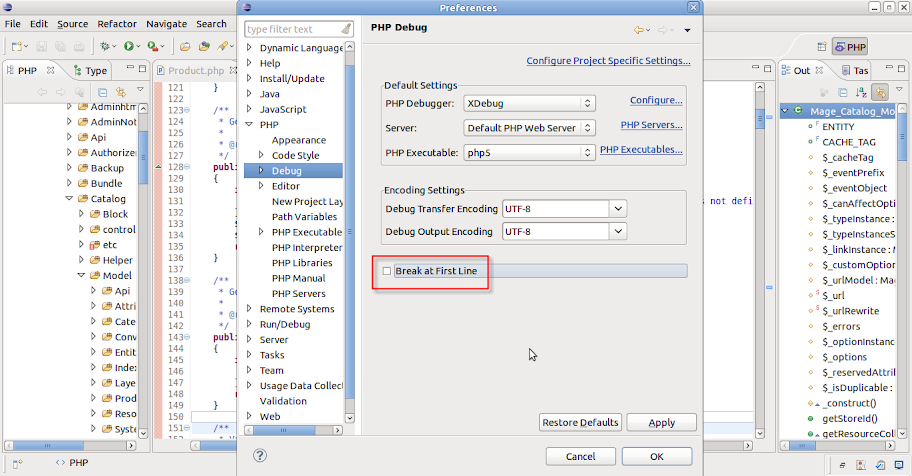
– On left sidebar, click ‘Debug’ menu present under ‘PHP’ menu (PHP -> Debug)
– Click ‘PHP Executables‘ link as highlighted in the figure below.
– A new window will popup. Add the following:-
Name = php5
Executable path = /usr/bin/php5
PHP debugger = XDebug
Leave other fields as they are (without any changes).
– Uncheck ‘Break at First Line‘ as shown in the figure below.
– On left sidebar of ‘Preferences’, click ‘PHP Servers‘ menu present under ‘PHP’ menu. You will see the following screen.
– If you keep your webserver URL as ‘http://localhost‘ then you can skip this step. Otherwise click on the ‘Edit’ button. Then, you will see the following screen.
– I am updating the URL to ‘http://127.0.0.1‘
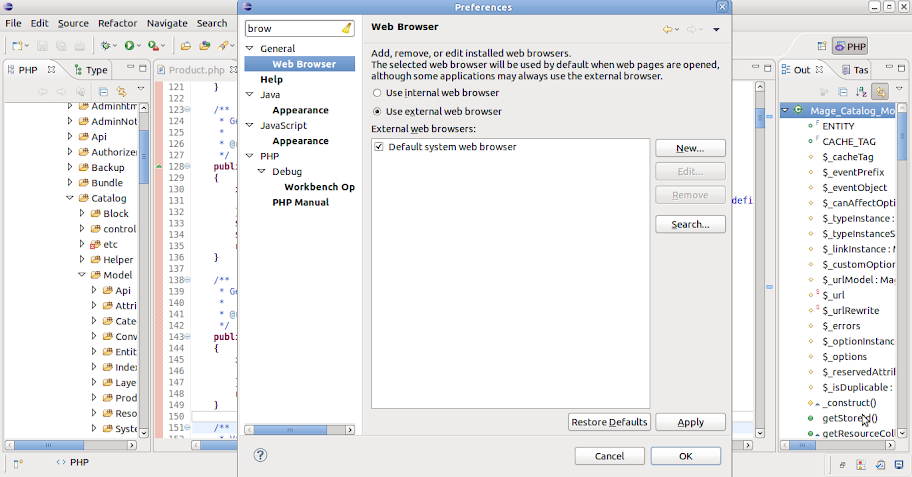
– On left sidebar of Preferences, there is a search bar on top. Search for ‘browser’ and you will see the following screen. Click on ‘Web Browser‘ present under ‘General’ menu. And, you will see the following screen. Note that, here you have to select ‘Use external web browser’ and then click OK.
– On PHP Eclipse, under menu bar, you will see the following debug icon.

– Click on the debug icon and you will see a dropdown menu. Click ‘Debug Configurations‘ menu from it. Then you will see the following screen.
– In the figure above, I have already performed some necessary steps. Here are they :-
– Right click on ‘PHP Web Page‘ and select ‘New’.
– Name it your new web page debug configuration. Like in the figure below, I have named my configuration as ‘magento1510’. On my web root, I have a folder/project named ‘magento1510’. I have given the File path to the index file of my project. So, it is ‘/magento1510/index.php’.
– Click ‘Apply’.
All the necessary settings have been completed. Now, you are ready to create breakpoints and start debugging.
Hope it helps. Thanks.


