Python: Graph plotting with Matplotlib (Bar Chart) - Mukesh Chapagain Blog
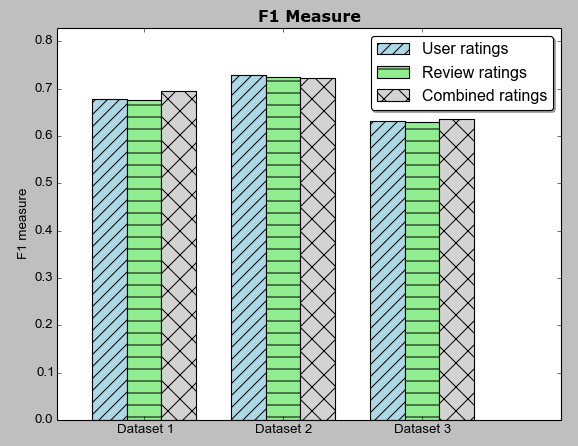
FacebookTweetLinkedInPinPrintEmailShares This article deals with plotting line graphs with Matplotlib (a Python’s library). Below is the data which we will use to plot the bar chart. The data is saved in a CSV file named result3-blog.csv. As seen above, the CSV file contains result in terms of F1 measure which is an accuracy measure generally ... Read more
Mukesh Chapagain